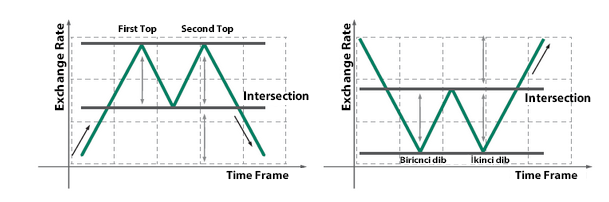
DOUBLE TOP AND BOTTOM
A term used in technical analysis to describe the rise of a stock, a drop, another rise to the same level as the original rise, and finally another drop. A charting pattern used in technical analysis that describes the drop of a price or a rebound, another drop to the same level as the original drop, and finally another rebound. The double bottom looks like the letter "W". The twice touched low is considered a support level. Reversal patterns suggest that one trend is ending and the market is ready to begin another trend in the opposite direction or, perhaps more likely, to move sideways for a while.
HOW TO BE A TRADER?
We invite you to meet Mekness investment world. You can follow the steps below to be an online investor with us.
-
You can fill the free demo account form on the side to open an unreal account and try the market without any risk.
-
You can apply to open a real account to enter the world of investment.
-
After depositing the initial investment you can easily start to trade.
LEGAL: This website is operated by Mekness Limited Registration No: 2024-00682.
Registered Address: Ground Floor, The Sotheby Building, Rodney Village, Rodney Bay, Gros-Islet, Saint Lucia
Operational Address: office number 202, Blue Tower Sheikh Zayed Road UAE Contact: +971 43 88 4268 |
Risk Warning: Trading Forex and Leveraged Financial Instruments involves significant risk and can result in the loss
of your invested capital. Your capital is at risk. Leveraged products may not be suitable for everyone.
Restricted Regions: Mekness does not offer its services to residents of certain jurisdictions such as USA, Canada, Japan, Iran, Federal Territory Labuan Malaysia, Cuba, Sudan, Syria and North Korea.