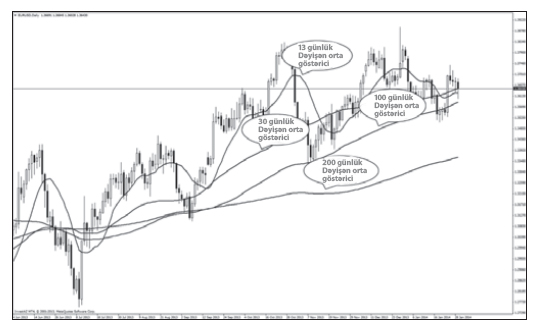
MOVING AVERAGE
The best known and simplest indicator of trends is the moving average. A Moving Average is an indicator that shows the average value of a security's price over a while.MAs lag current price action because they are based on past prices.
The moving average is displayed as a line on the chart. The line is constructed by taking the average price over a specific number of periods. If the price is above a moving average, it is higher than the recent price averages and thus it stands to reason that the price is moving up. Similarly, if the price is trading below a moving average it can be interpreted as the price moving down.
Breakouts of short MAs lead to a weak correction, in case, if long MAs are broken out, a strong correction wave will appear. Example: Moving averages can be of 89 periods on intraday charts, and at least 21 periods for weekly charts.
Short moving averages (5-20 periods) are best suited for short-term trends and trading. Long-term investors will prefer moving averages with 100 or more periods. The longer the time for the MA, the greater the lag.
MOVING AVERAGE IS CALCULATED AS FOLLOWS
MA= (Pn + Pn-1+.....+P1)/n
MA= Moving Average
Pn, Pn-1, P1= Closing price for the chosen timeframe
n= The number of days
Basic rules for trading with MAs.
1) To identify the intersection points and the average price graph;
2) Find a point following the maximum or minimum average;
3) Define the point of greatest divergence and the average price graph;
4) Follow the direction of a moving average.
SIMPLE MOVING AVERAGE
Simple MA is one of the widely used trading indicators in technical analysis. It represents the simple, or arithmetic average of a security over a defined number of periods. While MAs are useful enough on their own, they also form the basis for other indicators such as the Moving Average Convergence Divergence (MACD). The crosspoint of these indicators (MA9 and MA14) signals are the change of a current market trend.
Simple MA is calculated as follows:
MAn= ( P1+P2+...+Pn) / n
WEIGHTED MOVING AVERAGE
A type of moving average that gives more weight to recent data and less weight to older data. This indicator might be very useful for short term investments.
Calculation of the weighted MA:
WMA3 = (3P1+2P2 +P3) / (3+2+1)
EXPONENTIAL MOVING AVERAGE
A type of moving average that is similar to a simple moving average, except that more weight is given to the latest data. This gives the Exponential Moving Average the advantage of being quicker to respond to price fluctuations than a Simple Moving Average. However, that can also be viewed as a disadvantage because the EMA is more prone to false signals. For example, the crossover can sometimes be consolidation as well and may not provide a good signal.
Formula:
EMAk = ⅔ *P3 + ⅓ * EMAk-1

HOW TO BE A TRADER?
We invite you to meet Mekness investment world. You can follow the steps below to be an online investor with us.
-
You can fill the free demo account form on the side to open an unreal account and try the market without any risk.
-
You can apply to open a real account to enter the world of investment.
-
After depositing the initial investment you can easily start to trade.