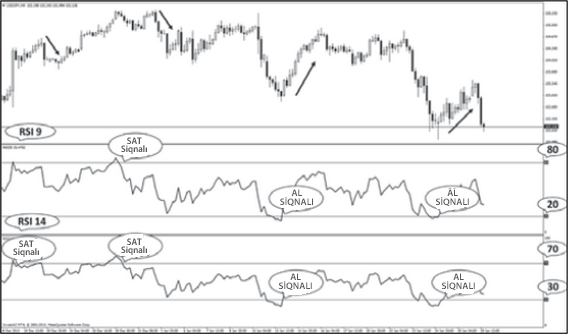
RSI OSCILLATOR
The relative strength index (RSI), one of the most frequently used momentum indicators, was developed by J. Welles Wilder in 1978. The RSI helps to measure the strength of a security's recent up moves compared to the strength of its recent down moves in a specific period. Since it is used to signal overbought and oversold conditions RSI helps traders to identify the market direction and upcoming corrections.
The formula to calculate the RSI is as follows:
RSI= 100 - (100/(1+RS))
RS= AUn / ADn
AUn = average of the closing prices of up days
ADn = Average of closing prices of down days
RSI also gives strong signals during the period of sideways.
HOW THE RSI IS USED
RSI always ranges between 0% and 100%. This technical indicator generates such signals as crossovers and divergence and indicates overbought and oversold conditions at the market. The optimal level for sale operations is 75, for buy operations - 25.
In the RSI, the overbought line is usually set at 75% and when the RSI is above this level the security is considered to be overbought. The security is seen as oversold when the RSI is below 25%. The relative strength index (RSI) is most commonly used for finding divergences. There are two types of divergence, bearish and bullish. Bullish RSI Divergence - when price makes a new low but RSI makes a higher low. Bearish RSI Divergence – When price makes a new high but RSI makes a lower high. This means that selling opportunity has weakened.

HOW TO BE A TRADER?
We invite you to meet Mekness investment world. You can follow the steps below to be an online investor with us.
-
You can fill the free demo account form on the side to open an unreal account and try the market without any risk.
-
You can apply to open a real account to enter the world of investment.
-
After depositing the initial investment you can easily start to trade.