TRIANGLES
Triangles are a common pattern and can simply be defined as a converging of the price range, with higher lows and lower highs. The converging price action creates a triangle formation. Though triangles are not the best way to precisely define the market direction they are frequently used chart patterns. Break of triangle lines indicates further price change. Breakouts of the upper triangle line mean price rise, while break out of lower lines indicates price fall.
The breakout will occur when the closing price is outside the triangle. However, breakouts resulted from short price fluctuations are not considered as such. After breaking a triangle prices move down.
The following formula helps to detect triangle breakouts:
P= ⅓ *T
P= Price range
T= Time range
-
SYMMETRICAL TRIANGLE

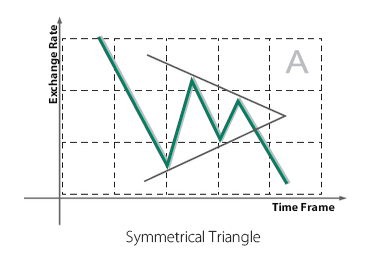
The symmetrical triangle is formed by the convergence of two trendlines drawn on a price chart and represents pauses or consolidations in a trend move.
Symmetrical triangles do not indicate the price direction. To trade a symmetrical triangle, you will have to wait until the breakout has occurred.
-
ASCENDING TRIANGLE

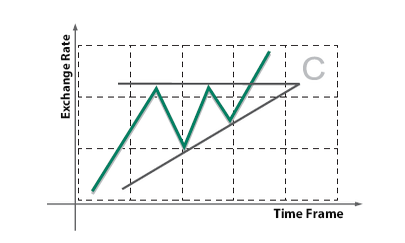
The ascending triangle represents a trend continuation pattern that is formed in an uptrend serving as a confirmation of the existing direction. The ascending triangle is characterized by a horizontal trendline called resistance and an ascending trendline called support.
If the price does violate the boundary (a breakout) of an ascending triangle, these violations should be regarded as signals for the uptrend. To be sure that the pattern has fully developed anticipation of the breakout must be taken into consideration.
According to J.Murphy during the formation of this model, a series of false signals becomes generated.
-
DESCENDING TRIANGLE

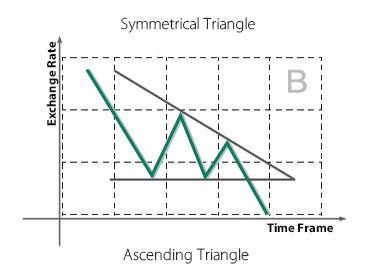
The descending triangle is the opposite of the ascending triangle and gives a bearish signal, suggesting that the price will trend downward upon completion of the pattern. The descending triangle is formed with a flat support line and a downward-sloping resistance line.
TRIANGLE
PATTERNS
The triangle is a correction pattern consisting of five main waves, three of them are also motive waves and two corrective waves. A Triangle pattern that arises in a downtrend indicates an expected continuing price fall. Breakout point occurs minimum at ½ or ⅓ of the way through the pattern's development. After the breakout (up or down), a new trend will be developed as support or resistance.
As a triangle shape develops, the volume tends to decrease, after the breakout of the triangle borders the volume sharply increases. Breakouts lead to a price rise or fall at least in the size of a triangle.
HOW TO BE A TRADER?
We invite you to meet Mekness investment world. You can follow the steps below to be an online investor with us.
-
You can fill the free demo account form on the side to open an unreal account and try the market without any risk.
-
You can apply to open a real account to enter the world of investment.
-
After depositing the initial investment you can easily start to trade.