GRAPHICAL METHODS
The graphical analysis is the simplest analysis of the price changes. There are several types of price graphs and charts available. In all the price graphs the vertical axis shows the price changes and the horizontal axis shows the time.
TICK CHART
Tick charts each time display a new quota of price changes. Compared to other price charts there is no fixed time axis on this graph. Every new price movement is displayed on the tick chart through the replacement in a vertical direction of a horizontal axis. There can be multiple price changes lines at the active markets and fewer price changes at the relatively stagnant markets.
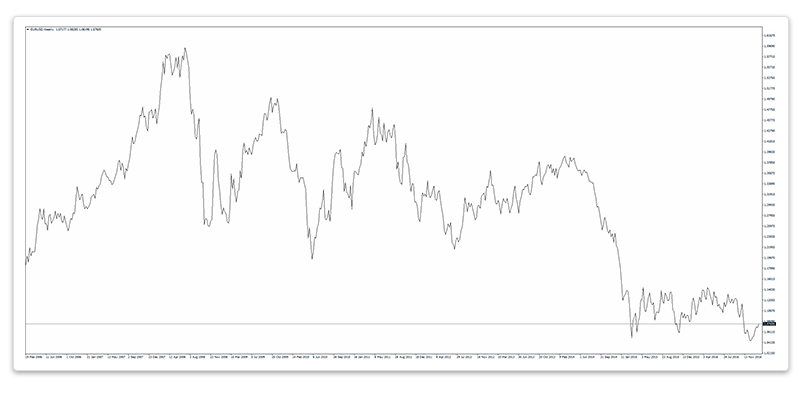
LINE CHART
The line chart displays only price movement details. Line charts provide сlose prices carried out only in a one-time frame. Due to a simple structure, this chart is mostly used for the analysis of long-term tendencies. Line charts do not display price changes in up and down directions in a specified period and may not be sufficient in short term analysis.
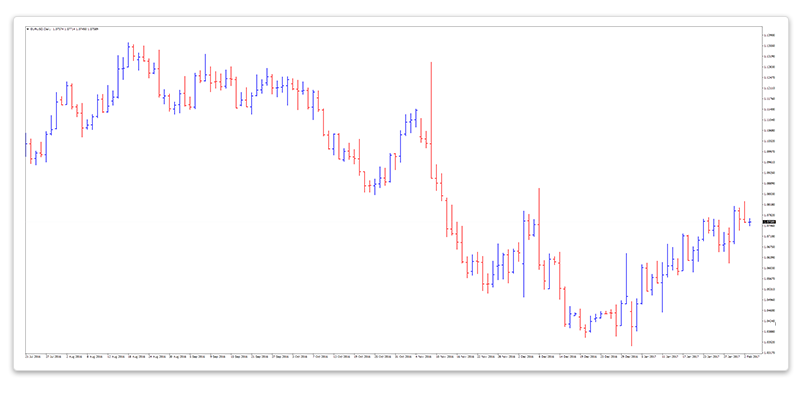
BAR CHART
The bar chart is one of the simple methods of graphical analysis that is widely used in the FOREX market. Bar charts display all the specific features of price changes in a relevant time. The bars in a chart along with the highest and lowest lines of price movements in a known time show open and close prices in a specified time.
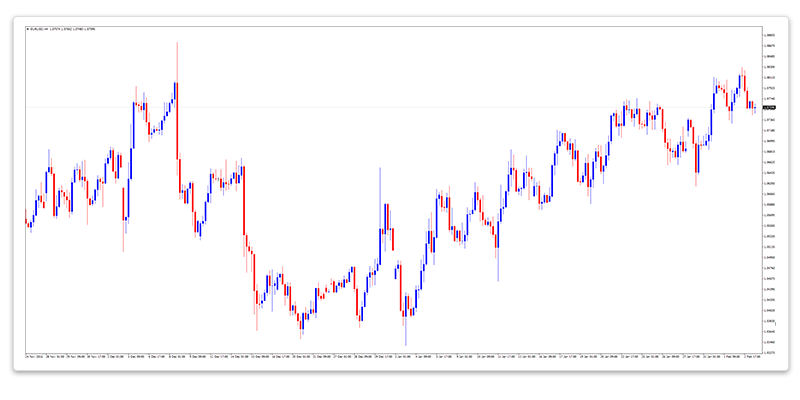
CANDLESTICK
Candlesticks - is a style of charting used to describe price movements of a financial instrument. It displays the high, low, opening, and closing prices for a security for a single day. Candlesticks are usually composed of the "real body" which usually tells investors whether the closing price was higher or lower than the opening price (black/red if the stock closed lower, white/green if the stock closed higher). Candlesticks are the indicators that reflect the emotions of buyers and sellers, display opening and closing prices, and give the most accurate signals. That's why candlesticks are widely used by many traders.
HOW TO BE A TRADER?
We invite you to meet Mekness investment world. You can follow the steps below to be an online investor with us.
-
You can fill the free demo account form on the side to open an unreal account and try the market without any risk.
-
You can apply to open a real account to enter the world of investment.
-
After depositing the initial investment you can easily start to trade.