TYPES OF TRENDS
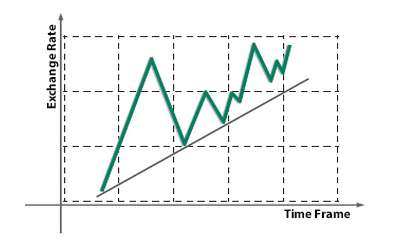
BULLISH OR UPWARD TREND
A bull market is a rising market. In a bull market, investors are positive. The trend line is a line that is drawn over pivot highs or under pivot lows to show the prevailing direction of price. Trendlines are a visual representation of support and resistance in any time frame. Since in a bullish trend orders are placed upwards it is very important to determine the lower trendline of an upward movement. Breakthrough a lower trend line signals that a general trend weakens or changes its previous direction.

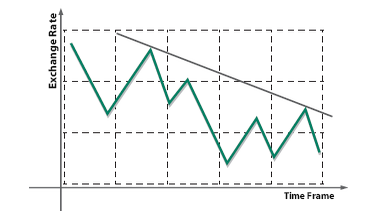
BEARISH OR DOWNTREND
A prolonged period in which investment prices fall, accompanied by widespread pessimism. A bear market is a market showing a lack of confidence. A lower trend line is a line that is drawn under pivot lows to show the prevailing direction of price. A bullish trendline is a visual representation of resistance. Since in a bearish trend orders are placed downwards it is very important to determine the upper trendline. Breakthrough an upward trend line signals that a general trend weakens or changes its previous direction.

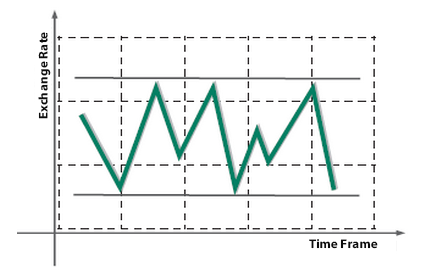
SIDEWAYS TREND
A sideways market occurs where the price trend of a certain trading instrument has been experiencing neither an uptrend nor a downtrend. A sideways trend is generally a result of the price traveling between strong levels of support and resistance. Sometimes, when a price moves in a reverse direction once the upward or downward trend is over, there are no certain price directions at the market. In this case, price fall or rise movements in a vertical direction are not expected. As a rule, when the sideways trend ends an uptrend or downtrend may begin.

HOW TO BE A TRADER?
We invite you to meet Mekness investment world. You can follow the steps below to be an online investor with us.
-
You can fill the free demo account form on the side to open an unreal account and try the market without any risk.
-
You can apply to open a real account to enter the world of investment.
-
After depositing the initial investment you can easily start to trade.