FIBONACCI NUMBERS
Leonardo Fibonacci was a talented Italian mathematician of the Middle Ages. Fibonacci numbers were first introduced in his Liber abaci in 1202. The Fibonacci numbers go like this: 0, 1, 1, 2, 3, 5, 8, 13, 21, 34, 55, 89, 144, 233...
Ralph Nelson Elliott, the father of the Wave Theory, described the wave principle in his major work entitled “Nature’s Law”. Therein, he introduced the concept according to which human behavior and emotionality are subject to nature’s law and tied to the Fibonacci.
Fibonacci sequence provides the mathematical basis of the Wave Principle.
GOLDEN RATIO
The natural world provides examples of this approximate ratio. The measurement of the human navel to the floor and the top of the head to the navel is the Golden ratio (1.618).
The golden ratio also called the golden mean or golden section is a special number approximately equal to 1.618.
FIBONACCI NUMBERS CHARACTERISTICS:
1) In the Fibonacci Sequence (0, 1, 1, 2, 3, 5, 8, 13, ...), each term is the sum of the two previous terms (for instance, 2+3=5, 3+5=8, ...). As you go farther to the right in this sequence, the ratio of a term to the one before it will get closer to the Golden Ratio.
For example, 3+5= 8 5+8=13
2) The ratio of any number in the Fibonacci series to the next number converges to 0.618.
For example: 3/5 = 0,6 5/8= 0,625 8/13= 0,615 13/21= 0,619 və s.
3) If we divide each number to the previous number, the result will be approximately 1,615.
For example: 13:8= 1,625 21:13= 1,615 34:21= 1,619
4) The higher the number goes in the sequence, the closer the ratio becomes to the 0,618 and 1,618. The ratio of any number in the series to the next number gets to 0.382 and to the previous number to - 2,618.
For example: 13:34 = 0.382; 34:13 = 2.615
5) Fibonacci numbers are also widely used to determine the price level at the market. Each new price movement wave may continue to 1.618 of the previous wave.
GOLDEN RATIO AND
ELLIOT'S WAVE
THEORY
Fibonacci numbers provide a mathematical basis of the Wave Principle. They play an important role in the measurement of correction waves.
One main trend has a 5 - wave structure. Complete cycle waves are divided into motive waves (marked with numbers) and corrective waves (marked with letters).
There are 3 simple wave models: 5-waves, Threes, and a Triangle.
There are 5 groups of simple wave models: Motive waves, Diagonal triangle, Zigzags, Double and Triple Zigzags.
RATIO ANALYSIS
Ratio analysis is the appraisal of the relations between the amplitude and the length of a wave. Ratio analysis has revealed several precise price relationships that occur often among waves.
There are two categories of relationships: retracements and multiples.
-
FIBONACCI NUMBERS AND IMPULSE WAVES
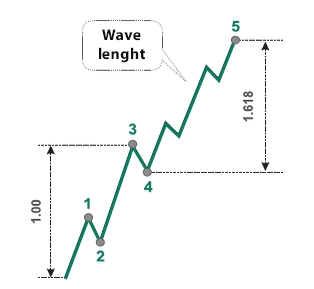
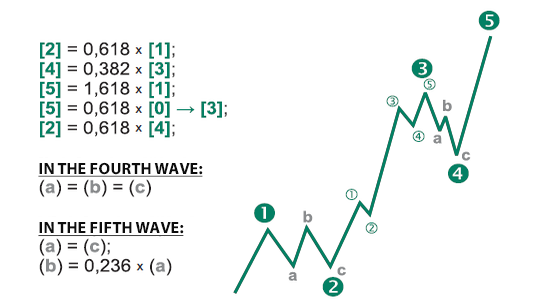
The 5th wave coming right after the 3rd one is equal to the 1st wave or 0.618 of the previous 3rd wave.
-
Wave 3 is equal to wave 1 and tends to be 1,618 and 2,618.
-

-
Unless wave 1 is extended, wave 4 often divides the price range of an impulse wave into the Golden Section.
-
When wave 5 is not extended, the ratio of the total distance is 0.382. When wave 5 is extended, it equals to 0.618.
-
These figures may change concerning the correction point only inside wave 4.
-
FIBONACCI NUMBERS AND CORRECTIVE WAVES
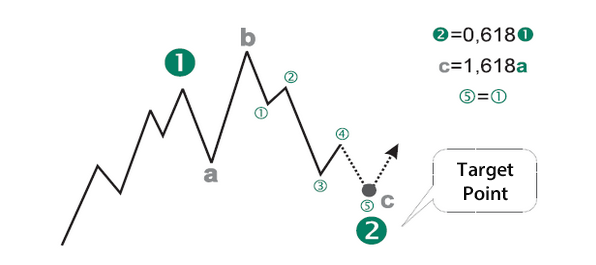
In zigzag correction figures, the length of wave C is usually equal to that of wave A, although sometimes it is 1.618 or 0.618 times the length of the wave A. In a regular flat correction waves A, B, and C are approximately equal. In expanded flat correction wave C is usually equal 1.618 times the length of wave A. In rare cases, wave C is 2.618 times the length of wave A.
-
FIBONACCI NUMBERS AND THE WAVE PRINCIPLE
The Fibonacci ratio may be often seen on price graphs of any period. Once a target price is confirmed by more than one Fibonacci relationship observed between the different price levels the impact of trade signals increases. For example, after a sharp decline for Wave 2, chartists can expect a relatively flat correction for Wave 4. If Wave 2 is relatively flat, then chartists can expect a relatively sharp Wave 4. In practice, Wave 2 tends to be a rather sharp wave that retraces a large portion of Wave 1. Wave 4 comes after an extended Wave 3. This Wave 4 marks more of a consolidation that lays the groundwork for a Wave 5 trend resumption.

The next image is an example of a perfect Elliott wave cycle. It shows the proportional relationship among the cyclic waves.

Fibonacci sequence, also known as the Golden Ratio, with its notable functionality in nature suggests its importance when seen in stock market cycles as well. Moreover, The Fibonacci sequence is vital to Elliott wave analysis since it provides the basis of the wave principle.
HOW TO BE A TRADER?
We invite you to meet Mekness investment world. You can follow the steps below to be an online investor with us.
-
You can fill the free demo account form on the side to open an unreal account and try the market without any risk.
-
You can apply to open a real account to enter the world of investment.
-
After depositing the initial investment you can easily start to trade.