ELLIOT WAVE THEORY
The Elliott Wave Principle is a form of technical analysis that traders use to analyze financial market cycles and forecast market trends by identifying extremes in investor psychology, highs and lows in prices, and other collective factors. Elliott used the different stock market indicators to discover that the ever-changing path of stock market prices reveals a structural design that in turn reflects a basic harmony found in nature. Based on this research, he developed a rational system of stock price analysis.
BASIC PRINCIPLES
-
According to the wave principle, every next move is always related to previous waves and is the reason for the upcoming market changes. A trader operates under the influence of the previous changes seen at the market, which in turn makes him take subsequent decisions. As mentioned above, every action in the financial market is followed by a reaction. These structures link together to form patterns. Since patterns are repetitive they have predictive value.
-
THE FIVE WAVE PATTERN
-
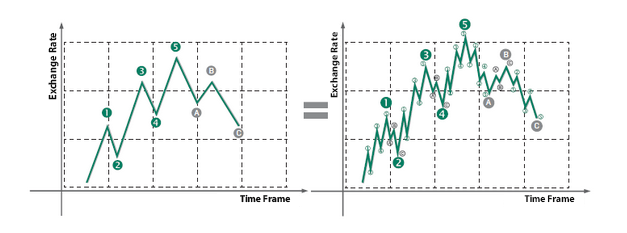
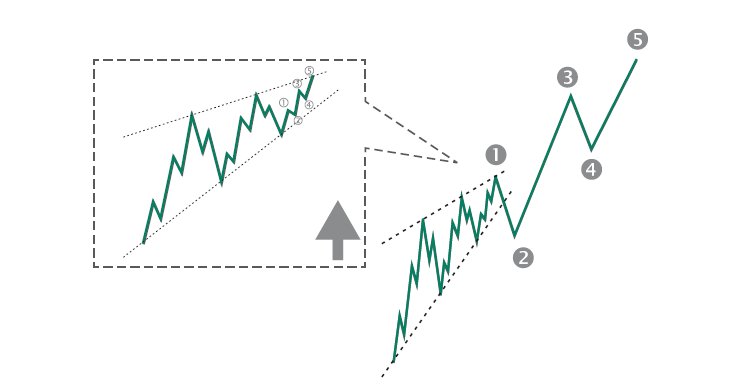
Markets movements ultimately take the form of five waves. Three of these waves, which are labeled 1, 3, and 5, actually effect the directional movement. They are separated by two countertrend interruptions which are labeled 2 and 4.
-
-
WAVE MODE
1) There are two modes of wave development: motive and corrective.
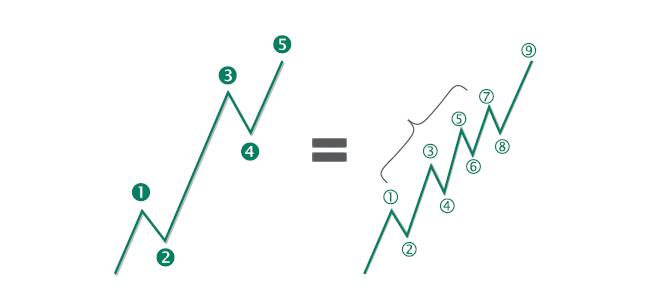
2) Motive waves have a five wave structure, while corrective waves have a three-wave structure.
3) Motive waves constitute the basis for the five-wave pattern. Their structures are called "motive" because they powerfully impel the market.
4) Waves 2 and 4 are corrective because they move against this bigger trend and form 1 and 3 waves.
5) After completion of the 5 waves cycle, the wave three begin to form. These corrective waves are denoted by letters a,b,c.
WAVE PERSONALITY
Wave 1
About half of the first waves are part of the "basing" process. As a rule, wave 1 is the shortest of impulse waves.
Wave 2
Second waves often retrace of wave one but still are held on the first wave.
Wave 3
The third wave is usually the longest and is characterized by dynamic growth. Third waves usually generate the greatest volume and price movement. They produce breakouts, "continuation" gaps, creating large gains in the market. Wave 3 cannot be the shortest of the 5 impulse waves.
Wave 4
Wave 4 has a complex structure and just as wave 2 is flat in the form of consolidation. The bottom of the fourth wave will never be equal to the peak of the first wave.
5-ci Wave
Waves 5 are always less dynamic than the third waves. During the formation of this wave technical indicators show declining strength and appear to be negative divergence indicating a weakening trend upward.
A Wave
Wave A appears once the movement is divided into 5 smaller waves and the trade volume at the market increases in a reverse trend.
B Wave
During the downtrend, this wave reflects a price upward rebound. Wave B is usually a low volume of turnover, may rise to reach, and even exceed the previous peak of wave 5.
C Wave
Wave C is often reduced below the bottom of a wave A. Head and shoulders pattern is formed as a result of drawing a trendline under the bottom of wave 4 and wave A.
DIAGONAL TRIANGLES
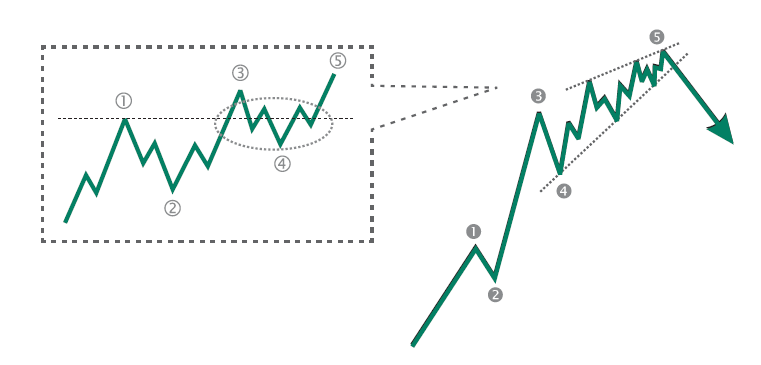
A diagonal triangle is a motive pattern yet not an impulse, as it has one or two corrective characteristics. Such patterns are seen on the fifth and the final wave position. As with impulses, no reactionary subwave fully retraces the preceding actionary subwave, and the third subwave is never the shortest. However, diagonal triangles are the only five-wave structures in the main trend direction within which wave 4 almost always overlaps the price territory of wave 1.
-
ENDING DIAGONAL
An ending diagonal is a special type of wave that occurs primarily in the fifth wave position at times when the preceding move has gone "too far too fast." A very small percentage of ending diagonals appear in the C wave position of A-B-C formations. In double or triple peaks they appear only as of the final "C" wave. Ending triangles are found at the termination points of larger patterns, indicating a further market movement.
-
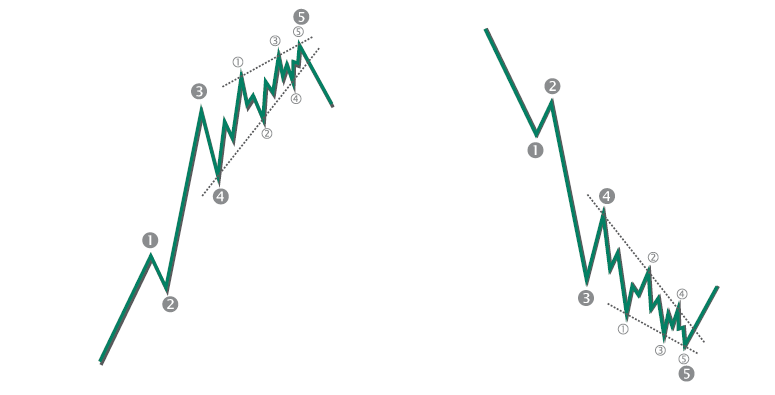
LEADING DIAGONAL
When diagonal triangles occur in the wave 5 or C position, they take the 3-3-3-3-3 shape. It has recently come to light that a variation on this pattern occasionally appears in the wave 1 position of impulses. The characteristic overlapping of waves 1 and 4 remains as in the ending diagonal triangle. However, the subdivisions are different, tracing out a 5-3-5-3-5 pattern.
ZIGZAGS
AND CORRECTIVE
WAVES
-
ZIGZAGS (5-3-5)
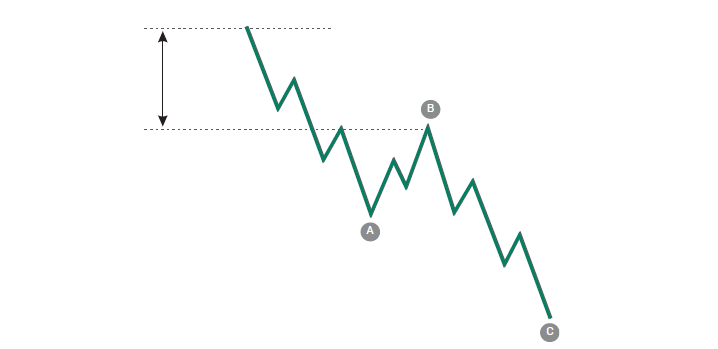
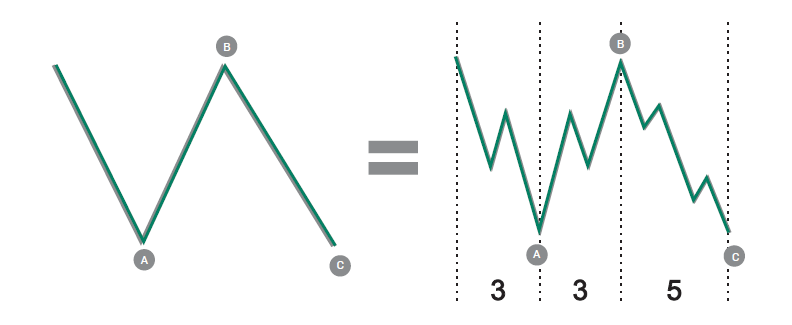
A zigzag is a simple three-wave declining pattern labeled A-B-C. The subwave sequence is 5-3-5, and the top of wave B is noticeably lower than the start of wave A.
-
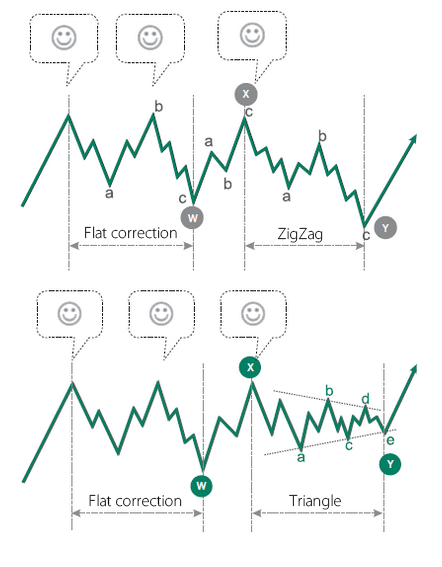
FLATS (3-3-5)
As shown in the figure below, a flat correction differs from a zigzag in that the subwave sequence is 3-3-5. Since the first active wave, wave A, lacks sufficient downward force to unfold into a full five waves as it does in a zigzag, the B wave reaction unfolds in 3 waves. Wave B rises to reach the peak of wave A indicating a strong market trend.
-
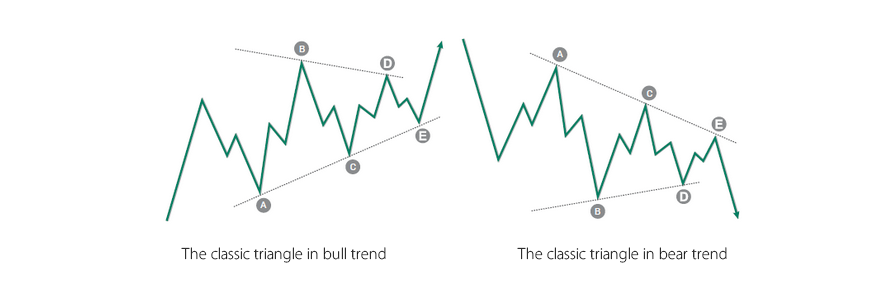
TRIANGLES (3-3-3-3-3)
Triangles reflect a balance of forces, causing a sideways movement that is usually associated with decreasing volume and volatility. Triangles contain five overlapping waves that subdivide 3-3-3-3-3 and are labeled a-b-c-d-e. A triangle is outlined by connecting the termination points of waves a and c, and b and d. Wave c can undershoot or overshoot the a-c line.
Ascending triangle
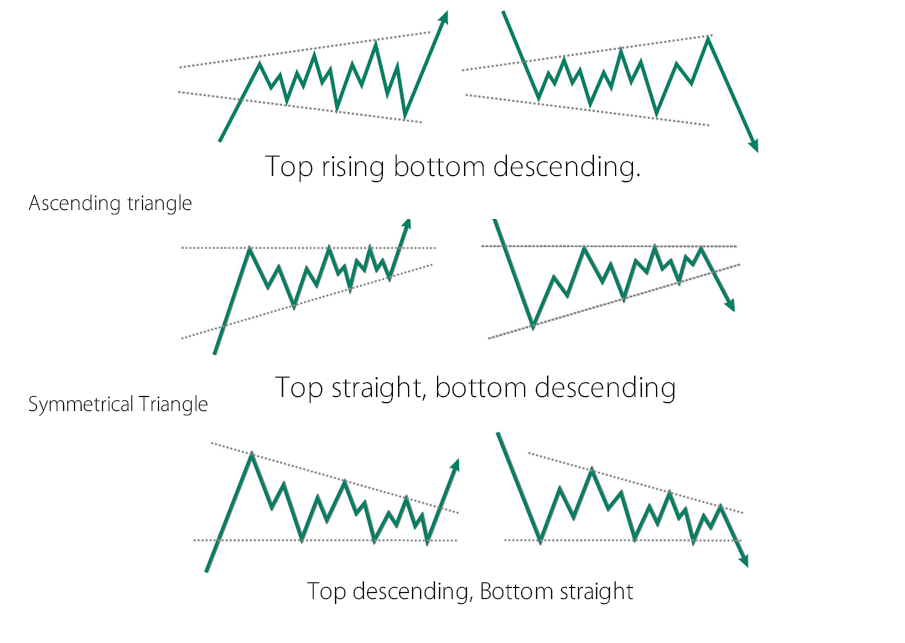
Reverse Symmetrical
triangle
DOUBLE AND TRIPLE THREES
Elliott called sideways combinations of corrective patterns "double threes" and "triple threes". A double or triple three is a combination of simpler types of corrections, including the various types of zigzags, flats, and triangles. As with double and triple zigzags, each simple corrective pattern is labeled W, Y, and Z. The reactionary waves, labeled X, can take the shape of any corrective pattern but are most commonly zigzags.
-
ORTHODOX TOPS AND BOTTOMS
Sometimes the end of a pattern differs from the price extreme level. In such cases, the end of the pattern is called the "orthodox" top or bottom to differentiate it from the actual price maximum or minimum that occurs inside the pattern.
HOW TO BE A TRADER?
We invite you to meet Mekness investment world. You can follow the steps below to be an online investor with us.
-
You can fill the free demo account form on the side to open an unreal account and try the market without any risk.
-
You can apply to open a real account to enter the world of investment.
-
After depositing the initial investment you can easily start to trade.